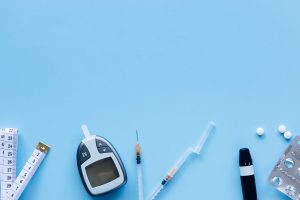
The standard metabolic panel through a polyclinic or Screen for Life screening (Singapore's subsidised chronic disease programme) includes fasting glucose. The result comes back at 5.3 mmol/L — well within normal range. The report generates no flags. Most people close the tab and move on.
The problem with that conclusion is not the test itself. It is what the test measures, and more precisely what it does not. Normal fasting glucose is the last metabolic marker to move in the progression toward insulin resistance. By the time it rises above any clinical threshold, the system holding it in check — your pancreatic beta cells secreting progressively larger volumes of insulin — may have been compensating for a decade. A normal fasting glucose does not rule out insulin resistance. It rules out the late, detectable stage of a process that begins much earlier.
Why a Normal Blood Test Result Can Mask a Decade of Metabolic Dysfunction
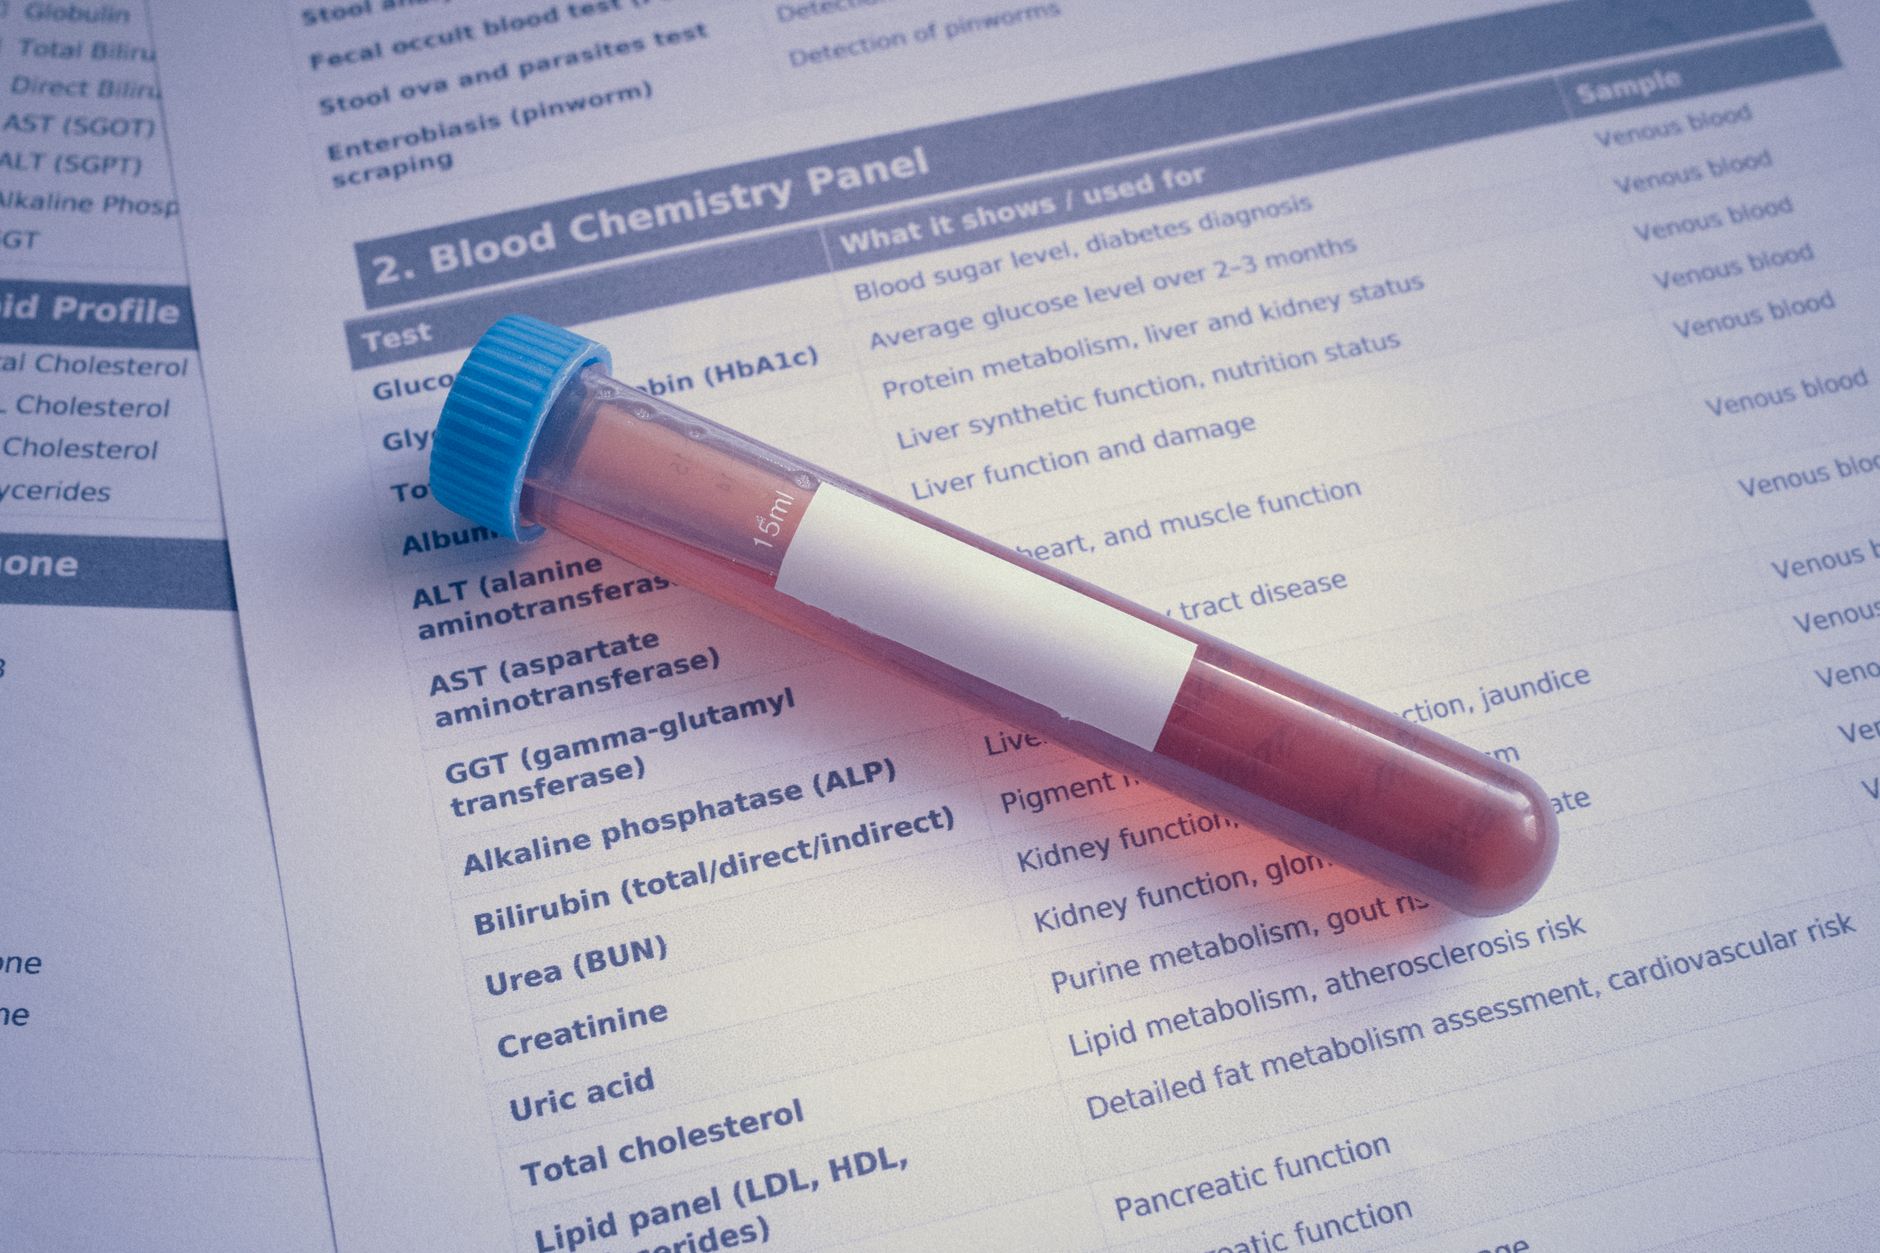
Insulin resistance develops along a continuum. In the early phase, skeletal muscle and liver cells gradually become less responsive to insulin's signal. The pancreas responds by secreting more insulin — enough to overcome the reduced cellular sensitivity and keep fasting glucose within normal range. This compensatory mechanism is effective. It can hold glucose at a level that generates no clinical flags for years.
The compensation itself carries a cost. Chronically elevated insulin promotes fat storage and places sustained demand on the beta cells producing it. By the time beta cell capacity starts to decline and glucose begins to rise, the metabolic dysfunction has been active long enough to accumulate meaningful cardiovascular and metabolic risk — largely invisible in a standard panel that measures glucose alone.
How Fasting Glucose Became the Default Screen — and Where That Default Falls Short
Fasting glucose is inexpensive, reproducible, and consistent across laboratory systems. It anchors standard metabolic panels because of those practical properties, not because it is the most sensitive marker of early dysfunction. The clinical threshold for impaired fasting glucose — 6.0 mmol/L under WHO criteria, reflected in MOH (Ministry of Health Singapore) clinical guidance — was established to identify people already far along the metabolic continuum, not to detect dysfunction in its earliest phase.
No single test captures the full picture. The limitation of fasting glucose as a standalone screen is not a flaw in the test but a mismatch between what it was designed to detect and what clinicians and patients often assume it can detect. The question is not whether fasting glucose is useful — it is — but whether it is sufficient for someone who wants to identify metabolic problems early enough to act on them.
The Mechanism: Compensatory Hyperinsulinaemia and the Glucose-Normal Window
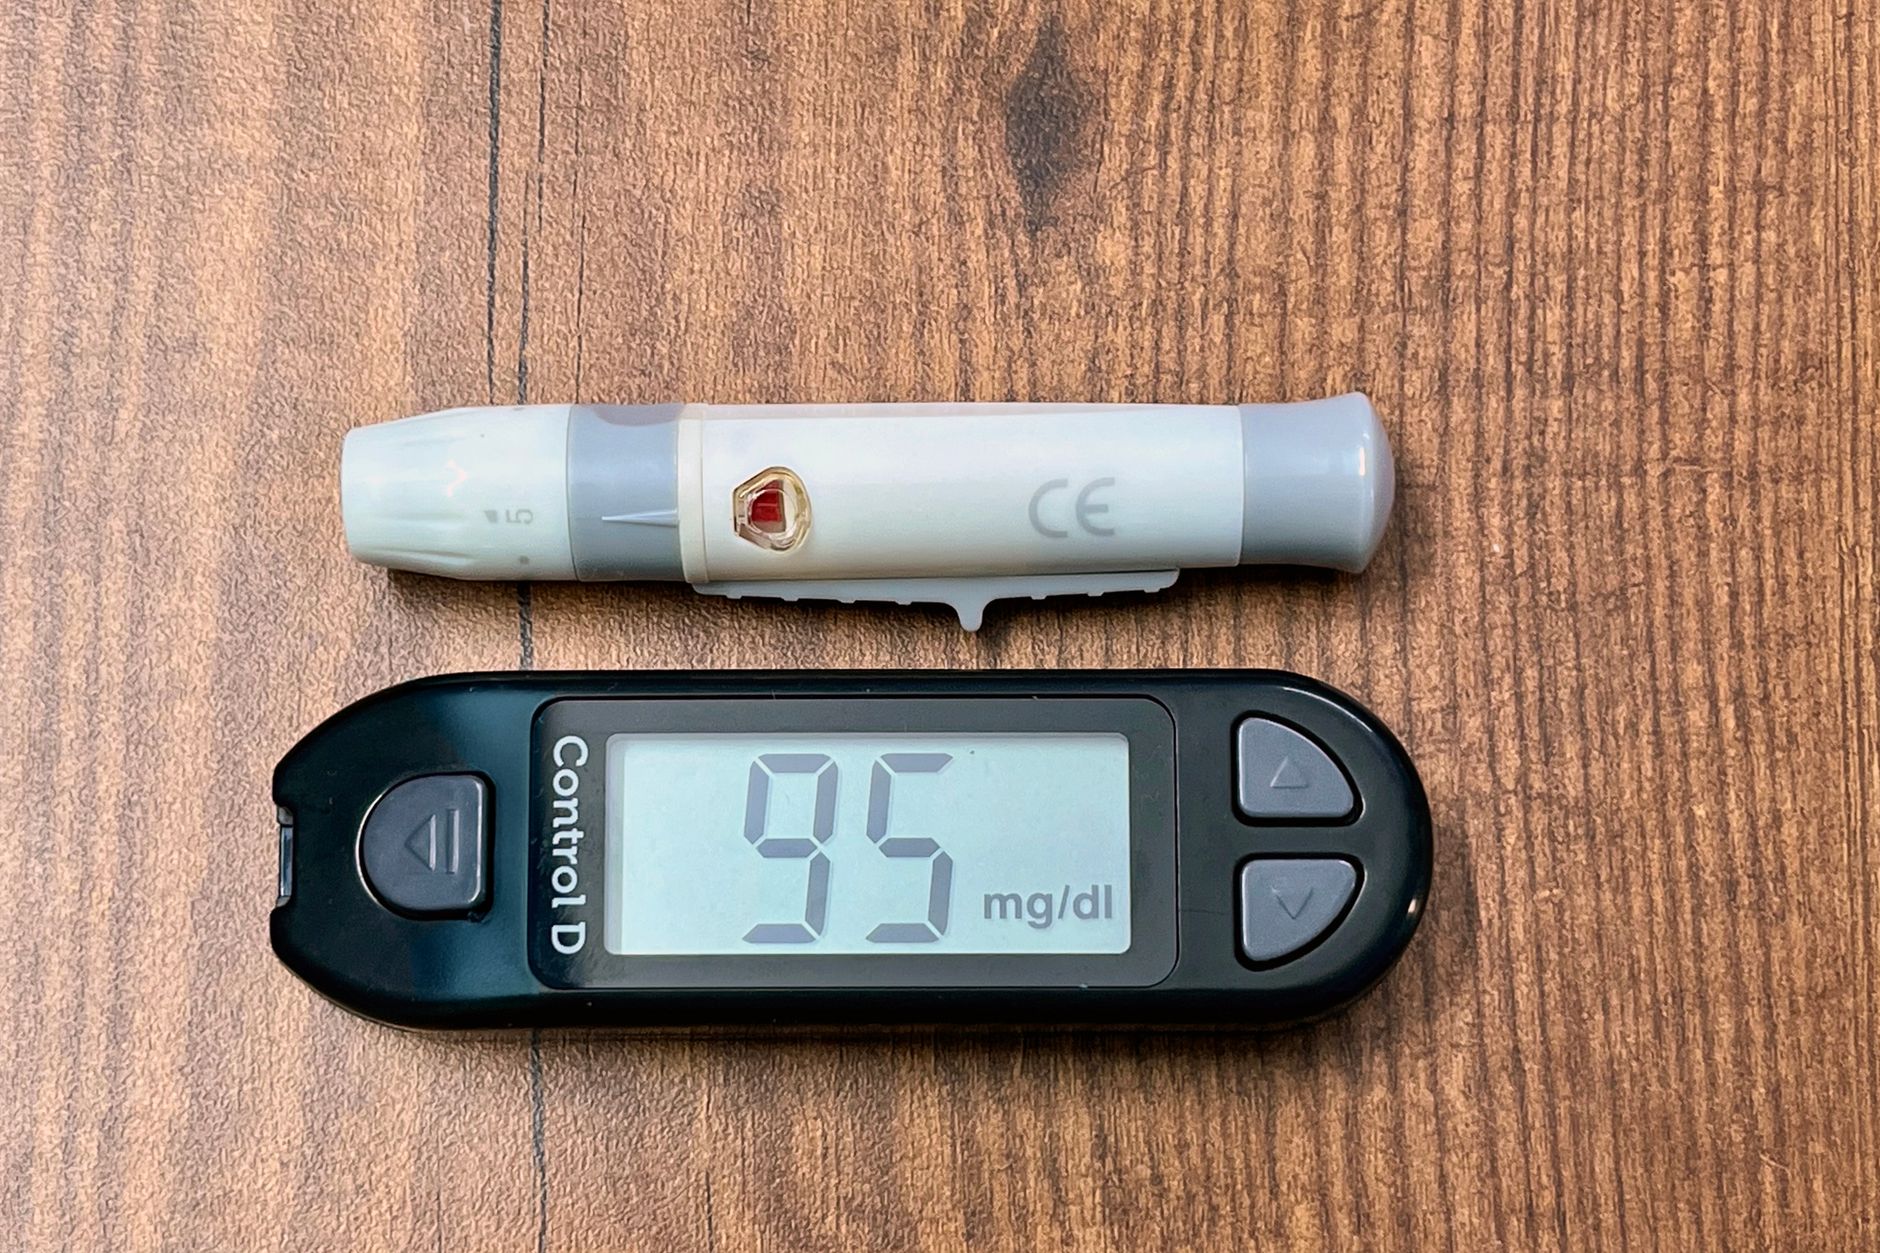
At the cellular level, insulin resistance is a failure of signal transduction — the process by which insulin binds to a receptor on the cell surface and triggers glucose uptake inside the cell. When this process becomes less efficient, the pancreatic beta cells detect the resulting rise in blood glucose and respond by releasing more insulin. The compensation works. Fasting glucose returns to the normal range. But the insulin level required to achieve that normal glucose is higher than it needs to be.
This state — elevated insulin maintaining normal glucose — is compensatory hyperinsulinaemia (excess circulating insulin produced in response to reduced cellular insulin sensitivity). The research confirms that this mechanism can sustain normal fasting glucose across a window of years while the underlying resistance progresses. Petersen MC and Shulman GI, writing in Cell Metabolism (2018), documented that skeletal muscle insulin resistance is typically the primary cellular defect and precedes hepatic glucose dysregulation — meaning glucose elevation is a downstream consequence, not the origin, of the problem. The pancreas is compensating for a muscle-level failure long before any glucose measurement reflects it.
The Earlier Markers: HOMA-IR and Fasting Insulin — Standard Clinical Ranges vs Longevity-Optimised Ranges

Two markers can detect insulin resistance during the glucose-normal window. Both are available from a single fasting blood draw — the same one used for fasting glucose.
Fasting insulin is a direct measurement of insulin concentration in a fasting blood sample. Most standard panels do not include it unless it is specifically requested.
HOMA-IR (Homeostatic Model Assessment of Insulin Resistance) is a calculated index: multiply fasting glucose (in mmol/L) by fasting insulin (in mIU/L), then divide by 22.5. It was developed to estimate insulin resistance from routine fasting measurements and is widely used in clinical research as a validated proxy for insulin sensitivity.
| Marker | Standard clinical range | Longevity-optimised range | The gap |
|---|---|---|---|
| Fasting glucose | < 6.0 mmol/L | 4.0–5.0 mmol/L | A reading of 5.8 mmol/L clears the clinical threshold while sitting well above the longevity-optimised target |
| Fasting insulin | 2–25 mIU/L (typical lab reference) | < 5 mIU/L | A fasting insulin of 18 mIU/L sits inside the clinical normal range while indicating a fourfold increase in compensatory insulin output relative to the optimised target |
| HOMA-IR | < 2.0 (no insulin resistance flagged) | < 1.0 | A HOMA-IR of 1.9 generates no clinical concern but represents nearly double the insulin secretion load of the longevity-optimised target — that doubling reflects accumulated, silent resistance |
The gap between a HOMA-IR of 1.9 and a HOMA-IR of 1.0 is not a rounding error. It represents nearly double the baseline insulin output required to hold glucose at the same level. That is the window where risk accumulates, and where both markers are visible if you look for them.
What the Research Shows: Evidence From Framingham, Cell Metabolism, and the NEJM
The research confirms that the glucose-normal compensatory window is clinically significant — not a benign holding pattern. The Framingham Offspring Study, a multi-decade prospective cohort tracking the adult children of the original Framingham Heart Study participants, has generated longitudinal data showing that elevated fasting insulin and impaired insulin sensitivity track with incident metabolic disease and cardiovascular outcomes across decades, years before fasting glucose reaches any diagnostic threshold.
The Diabetes Prevention Program (Knowler et al., NEJM, 2002) enrolled participants already in the late compensatory phase — impaired glucose tolerance maintained through elevated insulin output, with near-normal fasting glucose. Lifestyle intervention at this stage reduced progression to type 2 diabetes by 58% over three years. The implication is not only about efficacy. It is about timing: the glucose-normal window is the highest-yield point for intervention in the entire metabolic trajectory. Waiting for glucose to rise is waiting past it.
The UK Prospective Diabetes Study, published in The Lancet (1998), documented the progressive nature of type 2 diabetes — even with intensive glucose-lowering treatment following diagnosis, the underlying disease continued to advance. That progressive decline at the point of diagnosis is evidence that the metabolic process was already well-established before any glucose-based detection. By the time fasting glucose crosses a clinical threshold, the compensation has been running — and degrading — for years.
What to Do Instead: How to Request These Tests at Your Next Blood Panel
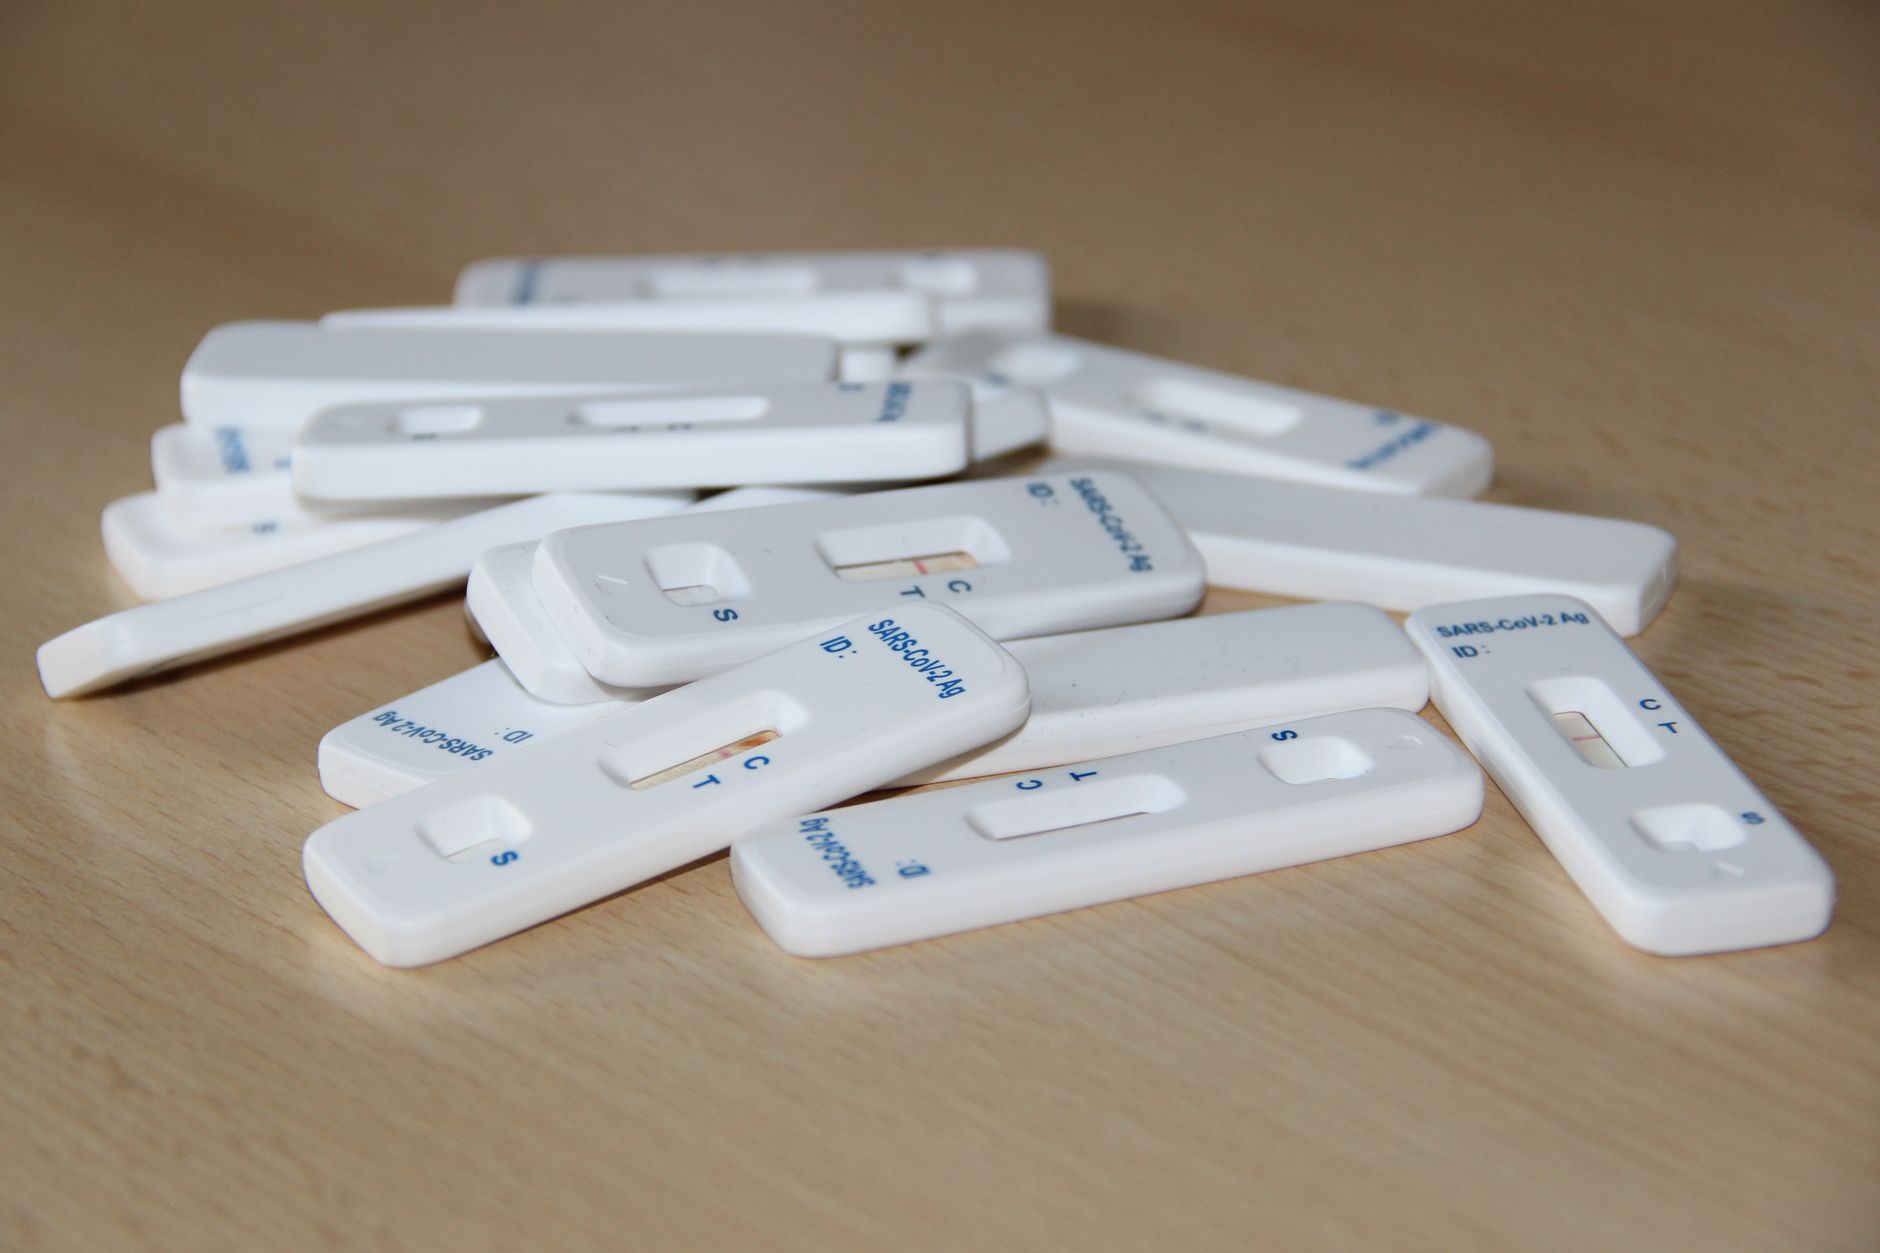
Fasting insulin is not a specialist test. Most private laboratories in Singapore offer it as an add-on to a standard metabolic panel, typically priced at $20–60 SGD (2026) depending on the provider. HOMA-IR is calculated from the two values rather than billed separately.
What to request at your next blood draw:
- Fasting insulin — confirm the unit with your lab. mIU/L is standard; some labs report in pmol/L. To convert pmol/L to mIU/L, divide by 6.
- Fasting glucose — this is likely already on your panel.
- Calculate HOMA-IR, or ask your clinician to do so: (fasting glucose in mmol/L × fasting insulin in mIU/L) ÷ 22.5.
When reviewing your results: a HOMA-IR below 1.0 with fasting insulin below 5 mIU/L represents the longevity-optimised range. A HOMA-IR between 1.0 and 2.0 — clinically normal, flagged by no standard panel — warrants a conversation with your clinician about dietary composition, physical activity, and sleep, all of which affect insulin sensitivity. A HOMA-IR above 2.0 indicates clinical insulin resistance regardless of what your fasting glucose reads.
If your current screening runs through Screen for Life at a polyclinic, fasting insulin is not a standard component of that panel. You can request it as an add-on or access it through a private panel — your clinician can advise on the appropriate route given your existing results and risk profile. Any changes to nutrition, movement, or supplementation based on these results should be discussed with your clinician before implementation, as the appropriate response depends on your full clinical picture. No dosage or intervention decisions should be made without that clinical guidance.
Take the Next Step: The 30-Day Biohacking Starter Guide

Now you know what the standard approach misses. The guide shows you what to do instead, starting tomorrow — with a day-by-day metabolic health protocol built specifically for Singapore's food environment and climate, covering how to move HOMA-IR and fasting insulin in the right direction through nutrition, movement, and recovery.
Medical disclaimer: This article is for educational purposes only and does not constitute medical advice, diagnosis, or treatment. All information presented here should be discussed with a qualified clinician before making any changes to your health management. WholeLiving does not provide clinical services.