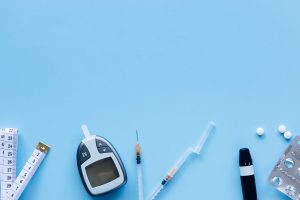
Your last blood panel probably came back with your fasting insulin flagged as normal. The lab's reference range extends to 25 µIU/mL; your result was 18. By that standard, nothing is wrong. By the standard that cardiovascular and metabolic ageing research actually uses, you are already in territory where long-term risk is accumulating. That gap — between what a clinical reference range permits and what the evidence on longevity supports — is what this article is about.
What Fasting Insulin Actually Measures
Insulin is the pancreatic hormone that signals cells to absorb glucose from the bloodstream. In a metabolically healthy person, a modest insulin rise after eating is followed by a swift return to a low fasting baseline. Fasting insulin — drawn after at least eight hours without food — reflects what the pancreas must produce just to hold blood glucose steady overnight. When cells become less responsive to insulin, the pancreas compensates by producing more. The result is a chronically elevated baseline: insulin resistance, measurable years before blood glucose moves outside its own clinical reference range.
This is the mechanism that makes fasting insulin a more sensitive early signal than fasting glucose or HbA1c (a three-month average of blood glucose attached to red blood cells, reflecting longer-term glucose control). Glucose stays normal precisely because the pancreas is working harder. The cost of that compensation shows in the insulin reading.
The Standard Clinical Range — and What It Was Designed For
Most laboratories report fasting insulin within a reference range of approximately 2.6 to 24.9 µIU/mL, though the upper boundary varies by lab and assay. This range is set statistically: it represents the middle 95 percent of values measured in a broadly defined population. It was designed for clinical utility — to flag pathological hyperinsulinaemia and rule out insulinoma, a rare insulin-secreting pancreatic tumour — not to identify the threshold at which long-term cardiovascular and metabolic risk begins to accumulate.
The distinction matters. A value of 18 µIU/mL is not acutely dangerous. But it is not neutral over a decade either.
The Longevity-Optimised Range: Where the Research Places the Target
The longevity-optimised range for fasting insulin, based on cardiovascular and metabolic ageing research, sits below 8 µIU/mL. Some analyses of risk curves in large prospective cohorts place the lowest-risk threshold below 5 µIU/mL.
The research suggests that fasting insulin values in the range of 5 to 15 µIU/mL — technically within clinical bounds — correspond to a meaningful increase in cardiovascular disease risk over long follow-up periods. A 2002 analysis drawing on Framingham Heart Study data, published in Diabetes Care by Hanley and colleagues, found that fasting insulin independently predicted cardiovascular events over a ten-year period at levels well below the clinical cut-off for insulin resistance. The mechanism is not simply glucose dysregulation: insulin itself promotes vascular smooth muscle proliferation, increases endothelial inflammation, and activates hepatic lipid synthesis — all of which show up in ApoB and hsCRP readings before HbA1c shifts.
The research confirms that the relationship between fasting insulin and cardiovascular risk is graded and continuous. There is no safe plateau at 20 µIU/mL simply because the lab did not flag it.
| Range | Category | Implication |
|---|---|---|
| Below 5 µIU/mL | Longevity-optimised | Lowest observed metabolic ageing signal |
| 5–8 µIU/mL | Acceptable | Within longevity-supported range; monitor annually |
| 8–15 µIU/mL | Subclinical concern | Elevated metabolic risk despite clinical “normal”; warrants panel expansion |
| 15–25 µIU/mL | Clinical borderline | High metabolic risk; prompt clinician review |
| Above 25 µIU/mL | Clinical abnormal | Flagged by standard lab reference range |
HOMA-IR: What a Single Reading Misses
A single fasting insulin value is informative but incomplete. HOMA-IR (Homeostasis Model Assessment of Insulin Resistance) combines fasting insulin with fasting glucose in a calculation validated in 1985 by Matthews and colleagues in Diabetologia: HOMA-IR = (fasting insulin in µIU/mL × fasting glucose in mmol/L) ÷ 22.5.
HOMA-IR provides a composite picture: two people with the same fasting insulin reading can have materially different insulin resistance if their fasting glucose differs. A HOMA-IR score below 1.0 is considered longevity-optimised in most clinical research contexts; a score above 1.9 is associated with clinically significant insulin resistance in large prospective cohort analyses.
The research confirms that HOMA-IR is more predictive of downstream metabolic and cardiovascular risk than fasting insulin alone, though it requires both markers to be drawn from the same fasted blood sample.
How Insulin Resistance Progresses — and Why HbA1c Misses the Early Stage
The conventional metabolic screening sequence is to check fasting glucose, then — if elevated — to check HbA1c. This sequence reflects how glucose dysregulation presents clinically. It is not the sequence in which metabolic damage accumulates.
Insulin resistance typically precedes glucose elevation by five to fifteen years. During that window, the pancreas maintains normal fasting glucose and normal HbA1c by producing progressively more insulin. The only marker that reflects this compensatory state is fasting insulin. Waiting for HbA1c to flag a problem means waiting until the pancreas can no longer compensate — by which point vascular and metabolic changes have been accumulating silently for years.
The research confirms this progression in prospective cohort data: elevated fasting insulin and HOMA-IR predict a type 2 diabetes diagnosis five to ten years before HbA1c crosses the pre-diabetic threshold of 42 mmol/mol.
Fasting Insulin and Cardiovascular Risk
The cardiovascular implications of chronically elevated insulin extend beyond its role as a diabetes precursor. At the endothelial level, insulin resistance is associated with reduced nitric oxide production, increased endothelin-1 (a potent vasoconstrictor), and elevated inflammatory markers including hsCRP (high-sensitivity C-reactive protein, a direct measure of low-grade systemic inflammation). These changes are measurable at fasting insulin levels in the 10–20 µIU/mL range — values that no standard blood panel flags as abnormal.
At the hepatic level, elevated insulin drives increased very-low-density lipoprotein (VLDL) synthesis, which raises small dense LDL particle count and elevates ApoB (apolipoprotein B, the structural protein on every atherogenic lipoprotein particle). This is why a full metabolic panel in someone with elevated fasting insulin often shows a normal LDL-C figure alongside elevated ApoB. The standard lipid panel measures cholesterol concentration, not particle number; when insulin resistance shifts the LDL distribution toward smaller, denser particles, LDL-C underestimates the atherogenic burden.
The research suggests that ApoB is a stronger predictor of atherosclerotic cardiovascular disease than LDL-C in individuals with elevated fasting insulin, based on consistent findings from large cohort studies including the INTERHEART study (The Lancet, 2004) and analyses published in the Journal of the American College of Cardiology.
Fasting Insulin and Metabolic Ageing
Beyond cardiovascular risk, chronically elevated fasting insulin intersects with several mechanisms of biological ageing. Insulin signalling interacts with the mTOR pathway (mechanistic target of rapamycin, a cellular growth and repair regulator) in ways that, when chronically active, suppress autophagy — the cellular clearance process that removes damaged proteins and organelles. Preliminary research indicates that chronically suppressed autophagy is associated with accelerated cellular ageing, though the direct clinical implications in humans remain an active area of investigation.
The more established pathway runs through visceral adiposity. Elevated fasting insulin promotes fat storage preferentially in visceral depots — the adipose tissue surrounding abdominal organs — rather than subcutaneous tissue. Visceral fat is itself pro-inflammatory, secreting cytokines that further elevate hsCRP and compound endothelial dysfunction. The research confirms this adiposity-inflammation cycle in large prospective cohort analyses, including data from the Nurses' Health Study (JAMA, multiple publications).
How to Get a Fasting Insulin Test
Fasting insulin is not included in standard lipid panels or in most primary care metabolic screens. To obtain a result, you will need to request it explicitly — either through your clinician or directly at a laboratory offering self-referral.
The test requires a minimum eight-hour fast, and the blood draw should be completed before eating, exercising, or taking supplements. Results are reported in µIU/mL or pmol/L; to convert pmol/L to µIU/mL, divide by 6.945. Pair the fasting insulin result with a simultaneous fasting glucose reading drawn from the same sample to calculate HOMA-IR. Never interpret a fasting insulin result in isolation from your fasting glucose.
Interpreting Your Result Against Both Ranges
Standard clinical range: 2.6–24.9 µIU/mL
Longevity-optimised range: below 8 µIU/mL, with below 5 µIU/mL representing the lowest observed metabolic ageing signal
If your result falls between 8 and 25 µIU/mL — within the clinical reference range but outside the longevity-optimised range — consider the following before your next panel:
- Calculate HOMA-IR using the fasting glucose from the same blood draw
- Request hsCRP to assess systemic inflammation
- Request ApoB and compare it against LDL-C to determine whether the standard lipid panel is understating your atherogenic particle burden
- Test annually rather than waiting for a clinical flag to appear
If your result is above 15 µIU/mL alongside a normal HbA1c, bring both values to your clinician's attention. The combination represents a pre-diabetic insulin phenotype that standard screening workflows are not designed to catch at this stage.
What to Do If Your Result Sits Between the Ranges
A fasting insulin result between 8 and 25 µIU/mL does not warrant alarm, but it warrants a structured response. The lifestyle interventions with the strongest evidence base for reducing fasting insulin are:
Resistance training: The research confirms significant reductions in fasting insulin and HOMA-IR across multiple randomised controlled trials of resistance training, independent of changes in body weight. Two to four sessions per week using compound movements constitutes a reasonable starting protocol — consult your clinician before beginning if you have existing joint or cardiovascular conditions.
Time-restricted eating: The research suggests reductions in fasting insulin of 10–20 percent in short-term trials of eight-to-ten-hour eating windows, with the mechanism likely related to reduced total postprandial insulin exposure across the day.
Reducing refined carbohydrate load: Not elimination, but targeted reduction — specifically foods with high glycaemic load consumed in isolation, which drive the largest acute postprandial insulin responses.
These are informed starting points, not prescriptions. Consult your clinician before making changes to your eating pattern or exercise protocol, particularly if you are on medication that affects glucose or insulin metabolism.
This article covers one piece of the system. The 30-Day Biohacking Starter Guide covers all of it, with a day-by-day protocol built specifically for Singapore. Download it at wholeliving.com/longevity-guide.