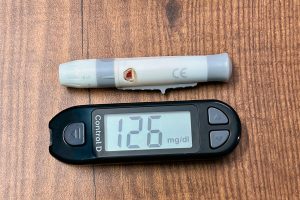
Most people who develop type 2 diabetes spend a decade in a metabolically compromised state before their fasting glucose crosses the clinical threshold. During those years, their standard lab results look normal. Their polyclinic blood panels — the kind subsidised through Screen for Life, Singapore's national subsidised screening programme — return no red flags. The damage, however, accumulates in the background: the pancreas compensating with more insulin, cells gradually becoming less responsive, cardiovascular risk climbing. By the time a diagnosis arrives, the problem has been present for years.
Singapore's disease burden reflects this pattern. The HPB (Health Promotion Board) National Nutrition Survey 2018 found that one in nine Singaporeans aged 18–69 had diabetes, with rates highest among Indians and Malays — populations that carry metabolic risk at lower body weights than Western populations. The national rice and noodle-based food environment, combined with desk-bound working patterns and ambient humidity that makes sustained outdoor exercise genuinely uncomfortable, creates specific conditions that generic longevity advice does not address. This protocol is built for that environment.
Why Insulin Sensitivity Matters for Longevity

Insulin sensitivity is the measure of how efficiently your cells respond to insulin — the hormone that signals cells to absorb glucose from the bloodstream. High insulin sensitivity means a small insulin signal achieves adequate glucose disposal. Low insulin sensitivity (insulin resistance) means the pancreas must produce progressively more insulin to move the same amount of glucose.
The longevity relevance extends well beyond diabetes risk. The research confirms that elevated fasting insulin and impaired glucose disposal are independently associated with accelerated cardiovascular disease, cognitive decline, and all-cause mortality, as documented across decades of prospective data from the Framingham Heart Study. Insulin resistance is, in effect, a slow leak in the cell's energy management system — and the standard clinical threshold for intervention flags it far later than the longevity-optimised range does.
Understanding the Three Insulin Sensitivity Markers

Three markers together give a complete picture. No single number is sufficient on its own.
HOMA-IR (Homeostatic Model Assessment for Insulin Resistance — a composite score derived from a single fasting blood draw) is calculated as: (fasting glucose in mmol/L × fasting insulin in µIU/mL) ÷ 22.5. It reflects how hard the pancreas is working to maintain normal blood glucose. The higher the number, the greater the resistance. The NIH National Institute of Diabetes and Digestive and Kidney Diseases describes insulin resistance as a defining early feature of metabolic syndrome, with HOMA-IR as the primary non-invasive estimate used in clinical research.
Fasting insulin is the direct measurement HOMA-IR draws on. Most Singapore labs report a reference range up to 20–25 µIU/mL — a range set to identify frank pathology, not optimise function. A fasting insulin reading in the upper half of that range signals the pancreas is compensating heavily, even if the number appears unremarkable on the printout.
HbA1c (glycated haemoglobin — the percentage of red blood cells with glucose molecules attached, reflecting average blood glucose over 10–12 weeks) is available via Screen for Life at polyclinics under CHAS (Community Health Assist Scheme) for eligible residents. Unlike fasting glucose, HbA1c cannot be manipulated by a single day of clean eating before your appointment, making it a more reliable trend marker. The American Diabetes Association Standards of Care 2024 classify HbA1c below 5.7% as normal — but the longevity literature treats the upper end of that range as a zone of accelerating risk.
Standard vs. Longevity-Optimised Ranges
| Marker | Standard Clinical Range | Longevity-Optimised Range | The Gap |
|---|---|---|---|
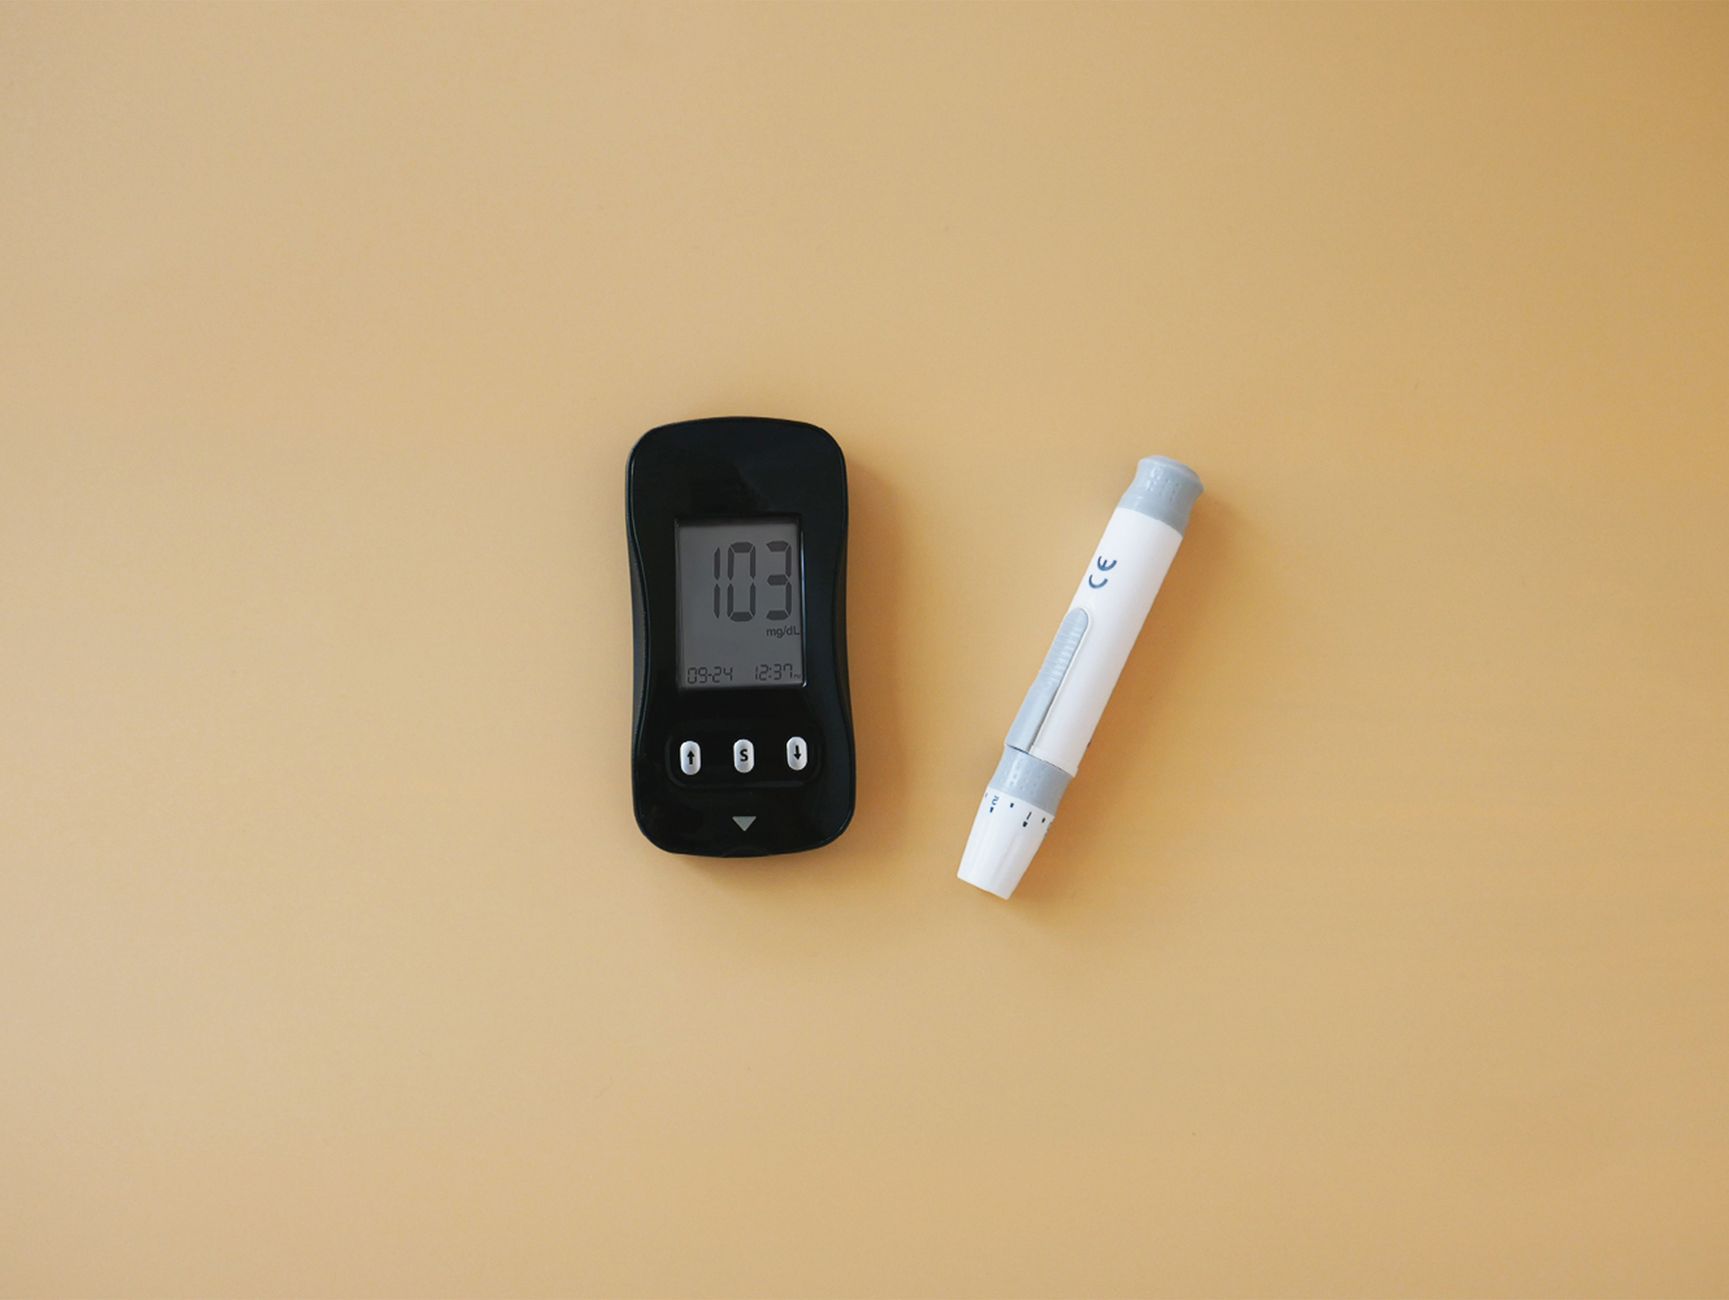
| HOMA-IR | < 2.5 | < 1.5 | A score of 2.4 is “normal” and also a signal of significant compensatory strain on the pancreas |
| Fasting insulin | 2–25 µIU/mL | < 8 µIU/mL | A reading of 18 µIU/mL clears every standard reference range while reflecting sustained insulin excess |
| HbA1c | < 5.7% | < 5.4% | The 5.4–5.6% band predicts elevated cardiovascular risk before any diabetes classification applies |
| Fasting glucose | 3.9–6.0 mmol/L | 4.4–5.0 mmol/L | A fasting glucose of 5.7 mmol/L is classified “normal”; it also reflects years of subclinical glucose elevation |
| 2-hour postprandial glucose | < 7.8 mmol/L | < 6.7 mmol/L | Postprandial spikes are invisible to a fasting-only panel; this is where hawker meal patterns often surface |
READ ALSO: HbA1c: What Your Result Actually Means for Long-Term Health
Step 1: Assess Your Current Status
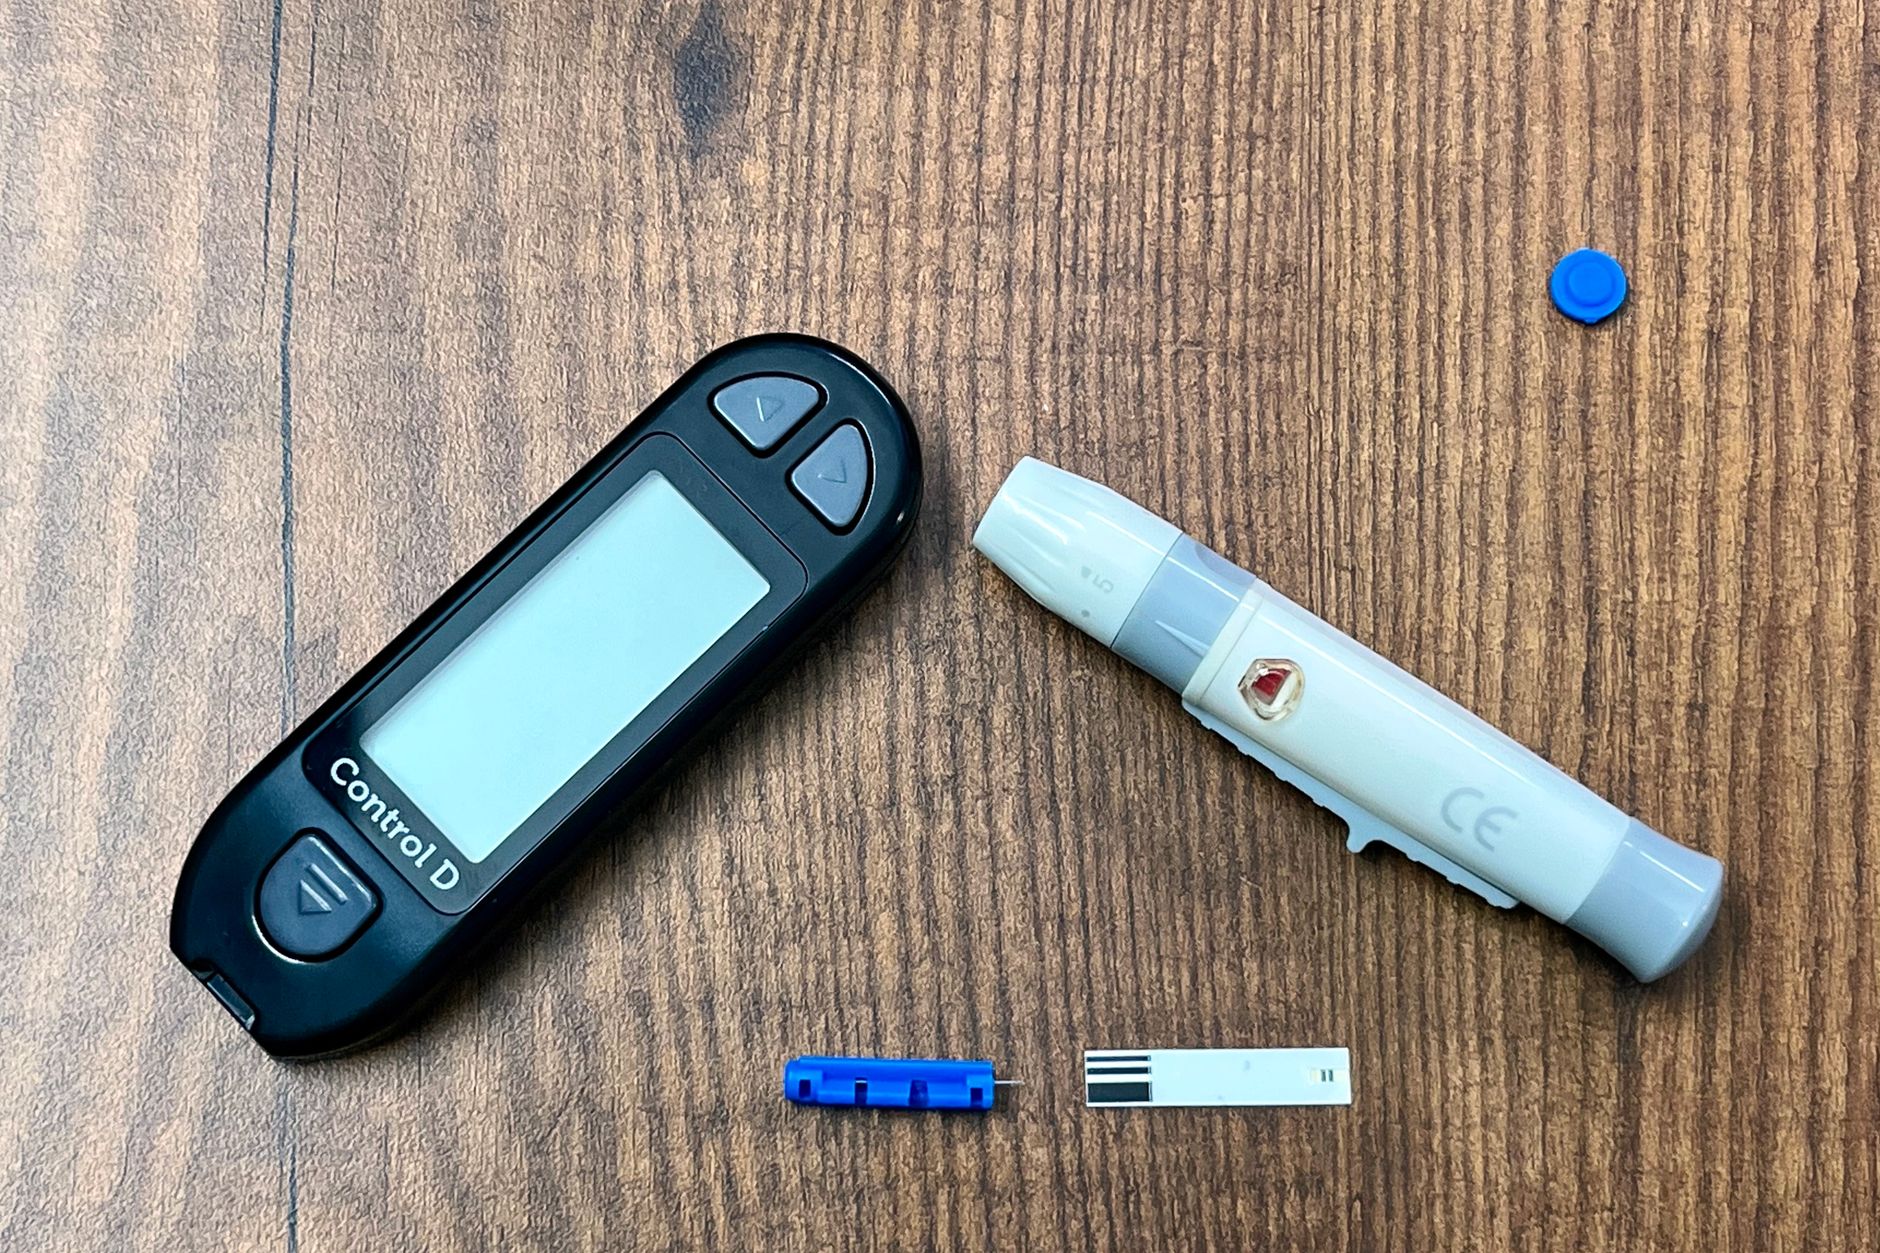
Before adjusting diet or training, you need a baseline panel. Request the following from your polyclinic GP or private clinic:
- Fasting glucose (mmol/L)
- Fasting insulin (µIU/mL) — this is not included in Screen for Life by default; request it separately
- HbA1c (%)
- Full lipid panel (ApoB if available; otherwise LDL, HDL, triglycerides)
Calculate HOMA-IR from your results: (fasting glucose × fasting insulin) ÷ 22.5. A private fasting insulin test costs approximately $20–35 SGD (2026) at most Singapore labs. It is not consistently subsidised under Screen for Life, but can be ordered by a GP on clinical grounds.
For a more dynamic picture, consider a continuous glucose monitor (CGM) worn for 14 days. CGMs are available without prescription in Singapore at approximately $80–120 SGD (2026) for a two-week sensor. They reveal postprandial spikes after your standard meals — nasi lemak, char kway teow, bak chor mee — that a fasting-only panel will not detect. Ideally, glucose should return to near-fasting levels within two hours of eating; the height of the spike and the time to return-to-baseline are both informative.
READ ALSO: How to Use a CGM Without a Diabetes Diagnosis
Step 2: Dietary Interventions for Insulin Sensitivity

The mechanism: refined carbohydrates cause rapid postprandial glucose elevation, demanding a proportionally larger insulin response. Repeated large responses cause receptor downregulation — cells reduce the sensitivity of their insulin receptors when insulin is chronically elevated, a feedback loop that compounds over years. Reducing the glucose signal allows receptor sensitivity to recover.
Lower glycaemic load. The research confirms that substituting high-glycaemic staples — white rice, white bread, sugared kopi, sweetened drinks — with lower-glycaemic alternatives reduces postprandial glucose spikes and, over weeks, improves fasting insulin and HOMA-IR. Harvard T.H. Chan School of Public Health's Nutrition Source documents the evidence base for glycaemic load as a predictor of metabolic outcomes across large prospective cohorts. For Singapore diets specifically: replacing half a cup of white rice with additional vegetables, or substituting brown rice, shifts the postprandial curve measurably without a complete dietary overhaul. Tapau (takeaway) hawker portions tend to be rice-heavy — requesting less rice is a practical, low-friction first step.
Time-restricted eating. The research suggests that compressing meals into an 8–10 hour window — for example, first meal at 8am, last meal by 6pm — improves insulin sensitivity independent of caloric restriction. A 2018 study in Cell Metabolism by Sutton and colleagues found that five weeks of early time-restricted eating improved insulin sensitivity, blood pressure, and oxidative stress in men with prediabetes, without weight loss. Consider this approach if your CGM data shows evening meal spikes as your primary pattern.
Post-meal movement. A 10–15 minute walk after eating lowers postprandial glucose by engaging muscular GLUT4 transporters — glucose channels that operate independently of insulin during physical activity, allowing muscles to clear glucose without an additional insulin signal. A 2016 randomised crossover study in Diabetologia by Reynolds and colleagues found that post-meal walking was more effective at reducing 24-hour glucose levels than a single pre-meal walk of equivalent duration in adults with type 2 diabetes.
Step 3: Exercise and Training Adaptations

Exercise improves insulin sensitivity through two distinct mechanisms: acute GLUT4 translocation — muscle cells open glucose transport channels during and for 30–60 minutes after exercise, requiring no insulin signal — and chronic mitochondrial adaptation, where regular training increases mitochondrial density in skeletal muscle, improving long-term fuel metabolism.
Both mechanisms require different training stimuli.
Zone 2 aerobic training. The research confirms that sustained low-to-moderate intensity aerobic exercise — the intensity at which you can hold a conversation, roughly 60–70% of maximum heart rate — is the primary driver of mitochondrial density in skeletal muscle. The American Heart Association recommends a minimum of 150 minutes of moderate-intensity aerobic activity per week for metabolic health; three to four sessions of 45 minutes each meets this threshold. In Singapore's climate — ambient temperatures of 29–34°C and relative humidity above 75% — outdoor heart rate targets based on temperate-climate studies will overshoot. Conversational pace is a more reliable cue than a strict beats-per-minute target when training outdoors.
Resistance training. The research confirms that progressive resistance training increases skeletal muscle mass — the primary site of glucose disposal in the body. A Cochrane review on exercise interventions for type 2 diabetes documents significant improvements in HbA1c and metabolic markers from structured resistance training programmes across multiple randomised trials. Two to three sessions per week of compound movements targeting large muscle groups (squat, deadlift, row, press) produces the greatest metabolic effect per training hour. Post-workout meals are the optimal window for carbohydrate intake — GLUT4 upregulation persists for 30–60 minutes after a session, improving glucose clearance without a proportional insulin spike.
READ ALSO: Zone 2 Training in Singapore: Adjusting for Heat and Humidity
Step 4: Lifestyle Factors
Sleep quality and duration. The research confirms that sleep restriction degrades insulin sensitivity within days. A 2008 study in PNAS by Tasali and colleagues demonstrated that selectively reducing slow-wave sleep duration in healthy adults significantly impaired insulin sensitivity and glucose tolerance, independent of total sleep time. The mechanism involves cortisol elevation and suppressed growth hormone secretion, both of which oppose insulin's glucose-disposal function. Seven to nine hours is the evidence-supported target. Shift workers and those with irregular schedules face a structural disadvantage that diet and exercise interventions cannot fully compensate for on their own.
Visceral fat reduction. The research confirms that visceral adipose tissue (fat stored around abdominal organs, as distinct from subcutaneous fat) directly impairs insulin signalling via inflammatory cytokine release. The MOH Singapore uses waist circumference thresholds of ≥ 90 cm (men) and ≥ 80 cm (women) as the at-risk cut-off for Asian populations — lower than Western cut-offs because East and South Asian populations carry metabolic risk at lower visceral fat volumes. Waist circumference is the most accessible clinical proxy for visceral fat without imaging, and a useful adjunct to HOMA-IR when tracking protocol response.
Stress and cortisol management. The research suggests that chronic psychological stress elevates cortisol, which directly antagonises insulin signalling at the receptor level — elevated cortisol promotes hepatic glucose output (the liver releases stored glucose into the bloodstream) and reduces peripheral glucose uptake, raising both fasting glucose and postprandial peaks. A structured approach to sleep scheduling and recovery, treated as a protocol element rather than an optional lifestyle choice, operates on the same mechanistic pathway as the dietary and exercise interventions above.
READ ALSO: How Chronic Stress Degrades Insulin Function
How to Monitor Your Progress
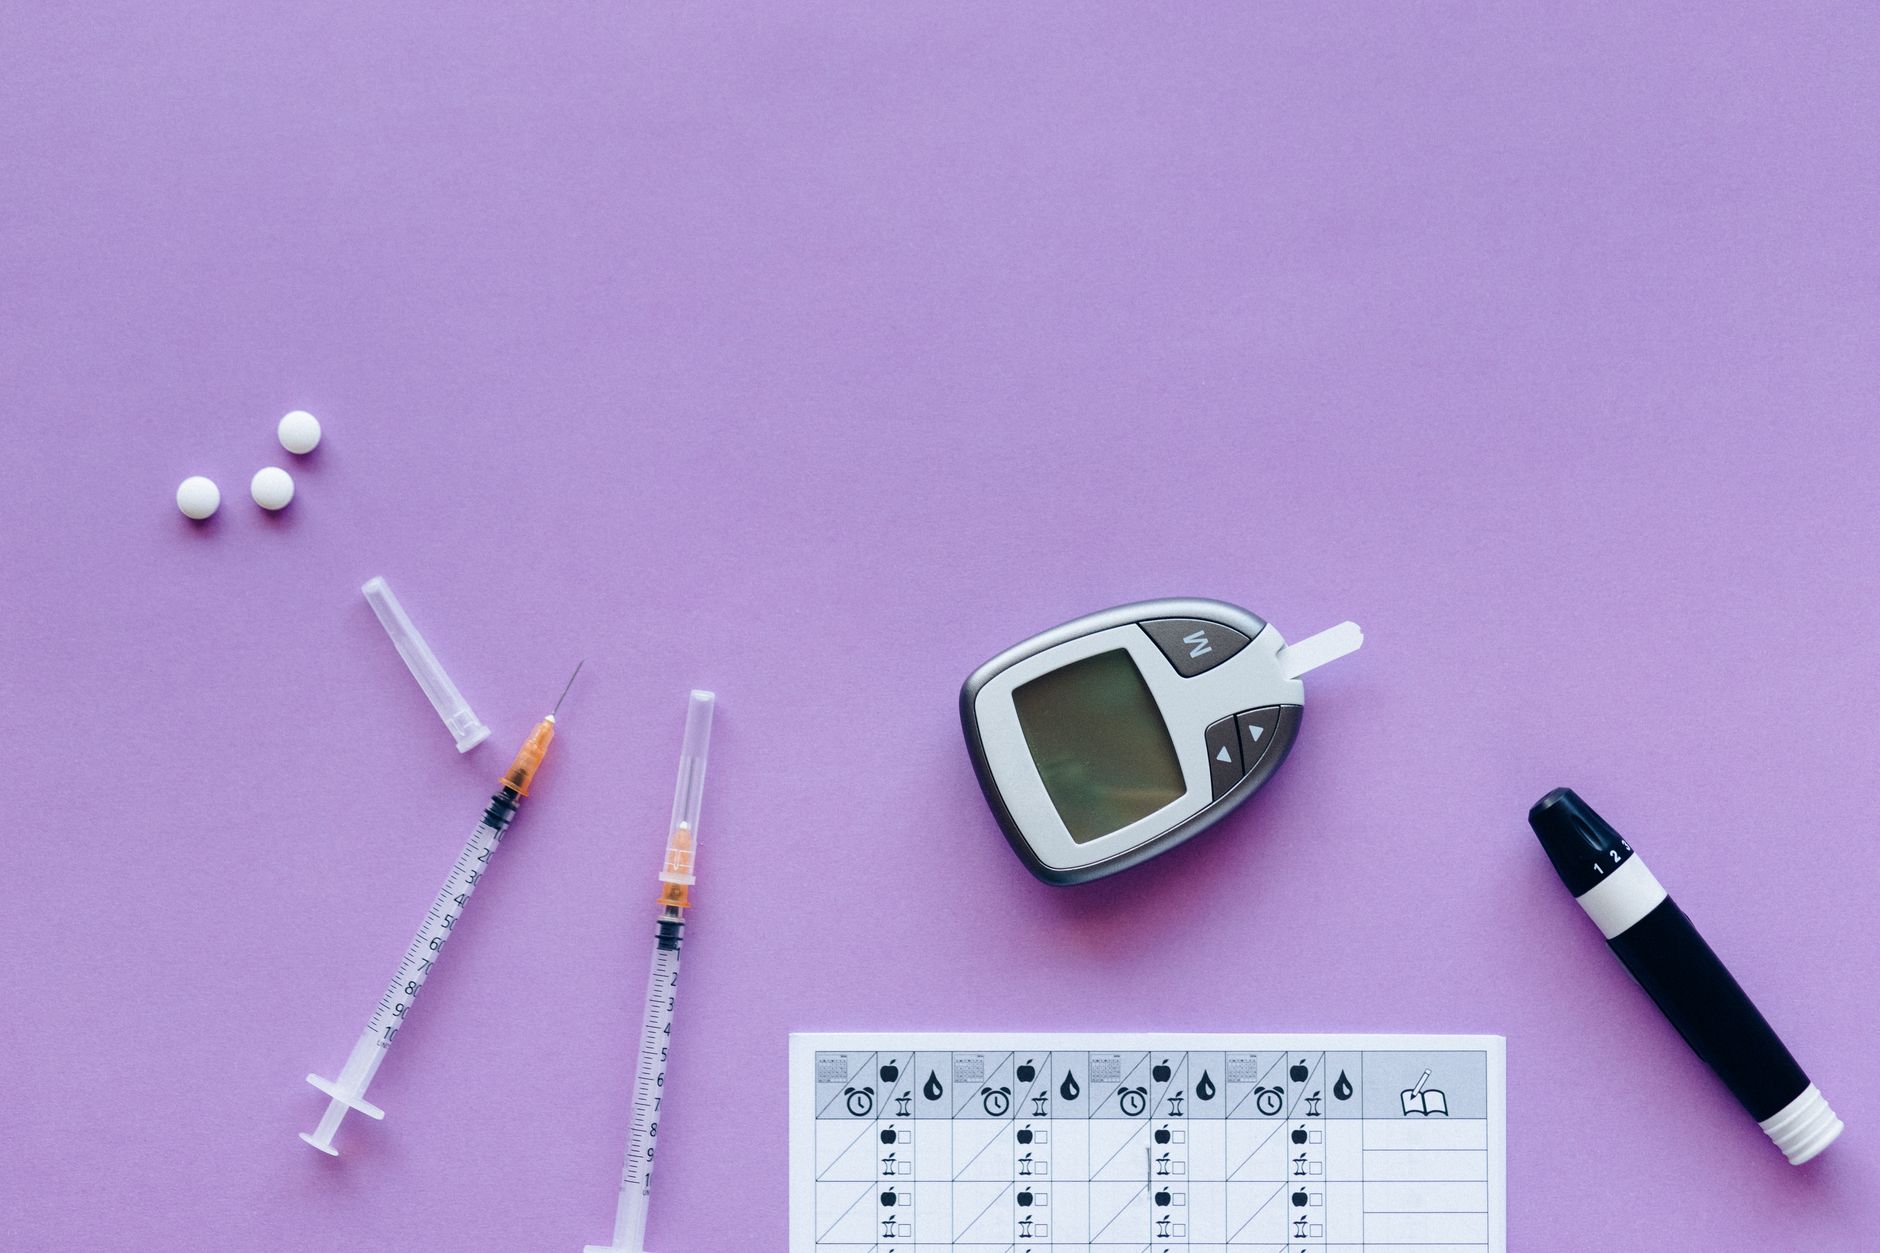
Retest fasting insulin, fasting glucose, and HbA1c at 12 weeks. HOMA-IR is recalculated from the new fasting values. HbA1c reflects a 10–12 week rolling average, so meaningful change requires the full duration before reassessment. Fasting insulin and HOMA-IR respond faster — movement is typically observable at 6–8 weeks if Zone 2 training and dietary changes are consistently in place.
CGM data provides faster feedback loops. Within two weeks of reducing refined carbohydrate and adding post-meal walks, the postprandial spike-and-return pattern shifts visibly on the trace. Use your CGM data to identify which specific meals produce the largest spikes: for most Singapore eating patterns, the primary contributors are white rice portions, sugared drinks, and late evening meals consumed within two hours of sleep.
Track against your personal baseline and the longevity-optimised ranges in the table above — not against population averages. The clinical cut-offs exist to diagnose disease. These targets exist to optimise function.
Your Next Step: The 30-Day Biohacking Sequence

This protocol is one step in a 30-day sequence. The 30-Day Biohacking Starter Guide gives you the full system, including what comes before and after this step — with a day-by-day protocol built specifically for Singapore conditions.
UP NEXT: HOMA-IR Explained: How to Calculate and Interpret Your Score
Medical disclaimer: The content on WholeLiving is for educational purposes only. It does not constitute medical advice, diagnosis, or treatment. Always consult a qualified clinician before making changes to your diet, exercise programme, or health protocols, particularly if you have existing health conditions or are taking medication. WholeLiving is not a clinical service and does not provide personalised medical guidance.